Trends in Computer Science and Information Technology
A Highly Efficient Computational Method for Particle Search and Positioning in 3D Cells: The Volume Comparison and Cartesian Cell Registration Approach
Yoshifumi Ogami*
Department of Mechanical Engineering, Ritsumeikan University, 1-1-1 Noji-Higashi, Kusatsu 525-8577, Japan
Cite this as
Ogami Y. A Highly Efficient Computational Method for Particle Search and Positioning in 3D Cells: The Volume Comparison and Cartesian Cell Registration Approach. Trends Comput Sci Inf Technol. 2025;10(1):011-024. Available from: 10.17352/tcsit.000092Copyright License
© 2025 Ogami Y. This is an open-access article distributed under the terms of the Creative Commons Attribution License, which permits unrestricted use, distribution, and reproduction in any medium, provided the original author and source are credited.This study introduces a simple yet effective computational method for particle search and positioning in 3D cells by combining the newly proposed Volume Comparison (VC) method with the Cartesian Cell Registration (CCR) method. Our method achieves a remarkable speed-up ratio of 9,675 relative to the brute-force search in rarefied gas flow simulations using the DSMC method with 61,047 computational 3D cells. Furthermore, our results indicate that the proposed method is approximately 4.45 to 5.73 times faster than the conventional methods, owing to the reduced number of cells requiring search. Moreover, it eliminates the time step restrictions inherent in the conventional methods by permitting particles to move beyond adjacent cells, this permits larger time steps, further reducing computational cost. Additionally, our method precisely performs particle search and positioning—determining whether a particle is located within three-dimensional convex or concave cells, regardless of type—and facilitates efficient computation of residence times by geometrically analyzing particle trajectories and their intersections with cell boundaries. These techniques effectively address challenges such as handling moving or deforming meshes without necessitating re-registration, employing the inverse deformation function to ensure robustness. By combining accuracy with computational efficiency, the VC and CCR methods prove highly effective for advanced simulations involving particle search and positioning in complex 3D environments, such as rarefied gases, solvents, diesel sprays in engines, molecules in nanoscale flows, the dynamics of granular materials, and the gas-phase equations of multiphase flows.
1. Introduction
Engineering fluid dynamics simulations frequently involve tracking discrete elements, such as particles in rarefied gases [1-3], solvents, diesel sprays in engines [4,5], molecules in nanoscale flows [6], or the dynamics of granular materials [7,8]. Accurately identifying the computational cell a particle occupies is essential for monitoring its movement over time. Moreover, determining the residence time of a particle in each cell it traverses is critical for calculating source terms in the gas-phase equations of multiphase flows [9-13].
Determining whether a particle resides within a polygonal cell (serving as a computational cell), the conventional methods sequentially track the particle from its starting cell to its ending cell, restricting movement beyond adjacent cells. As a result, a small time step size is required. For each cell, this process relies on multiple if-statements to evaluate the particle's position relative to the cell's edges, vertices, and intersections [6,9,10,14-16], requiring at least as many evaluations as the product of the number of edges (in 2D) or faces (in 3D) and the number of cells the particle crosses.
Compared to two dimensions, extending computational methods to three dimensions [17,18] substantially increases the computational burden and complicates code management, particularly in 3D simulations. Furthermore, if the cell is concave, the algorithm may enter an infinite loop [7]. For moving cells, it is crucial to ensure that the cell does not shift to such an extent that the particle moves beyond a single neighboring cell from its original position [7].
To improve computational efficiency for searching cells, and by taking advantage of the Cartesian grid system, Liang, et al. [19] proposed a DSMC method [1-3] that combines two levels of Cartesian grid systems combined with an unstructured triangular grid system. However, as pointed out by Wang Z. et al. [20], although this method improved computational efficiency, several calculations must be performed separately at the junction between the two types of grids, which is relatively tedious.
Moreover, the DSMC (Direct Simulation Monte Carlo) method is a numerical technique used to simulate gas flows, particularly under rarefied (low-density) conditions where traditional Navier–Stokes equations become invalid. Originally developed by G.A. Bird in the 1960s, DSMC has become a standard tool for studying non-equilibrium gas dynamics, such as those encountered in hypersonic flows, vacuum systems, micro/nano-scale flows, and upper-atmosphere physics.
Wang C, et al. [21] divided the computational domain into various rectangular regions within Cartesian grid systems that contain a small number of triangular cells. The particle trajectory is tracked by first searching the rectangular regions and then the triangular cells. This method also enhanced computational efficiency. However, the grid configuration is limited to triangular cells, and searching for cells in small areas can still be time-consuming.
Wang Z, et al. [20] also proposed the Background Cartesian Grid Positioning (BCP) technique for two-dimensional computations. In this technique, a structured grid system is superimposed onto a layer of a background Cartesian grid system, and the geometric relationship between the structured and background grids is established in advance to limit the cells that need to be searched later. Although their results showed a significant decrease in the computational time required for particle positioning, BCP is limited to structured grid systems. Furthermore, applying BCP to three-dimensional grids may be challenging.
To address these challenges, more efficient and simple methods using a distinctly different approach have been proposed: the Cartesian Cell Registration (CCR) method and the Area Comparison (AC) method [22,23]. The CCR method significantly reduces the number of cells to be searched by associating structured or unstructured computational cells with Cartesian cells (rectangles or squares), completely eliminating the need for sequential cell searches from the starting cell to the ending cell. The AC method simplifies particle localization by using a single if-statement for area comparison, while the conventional methods require multiple if-statements, often exceeding the number of edges (2D) or faces (3D) per cell. Moreover, the conventional methods involve fairly intricate programming that demands careful geometric analysis of the particle’s position relative to edges or faces. The CCR and AC methods were applied to rarefied gas flow around a two-dimensional circular cylinder, significantly reducing computational time compared to the brute-force method [23].
In this paper, the AC method is extended to three dimensions, leading to the development of the Volume Comparison (VC) method. The CCR and VC methods are applied to three-dimensional rarefied gas flow around a sphere using the DSMC method [1-3], achieving a speed-up ratio of 9,675 with 61,047 computational 3D cells. The speed-up ratio scales linearly with the number of cells. Furthermore, the results indicate that our method is approximately 4.45 to 5.73 times faster than the conventional methods due to the reduced number of cells that must be searched. Additionally, the proposed method eliminates the time step restrictions inherent in the conventional methods by permitting particles to traverse nonadjacent cells, this permits larger time steps, further reducing computational cost.
This paper also explores how both the CCR and VC methods track particle paths from the starting cell to the ending cell to compute residence times in each cell. It further discusses aspects related to concave and moving cells.
2. Cartesian cell registration method
2.1 Three-dimensional mesh around a sphere
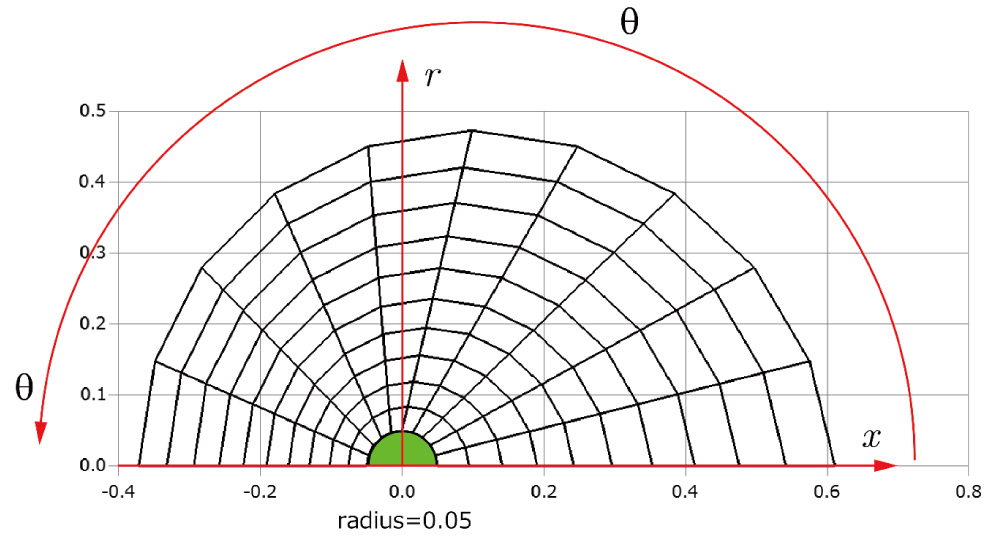
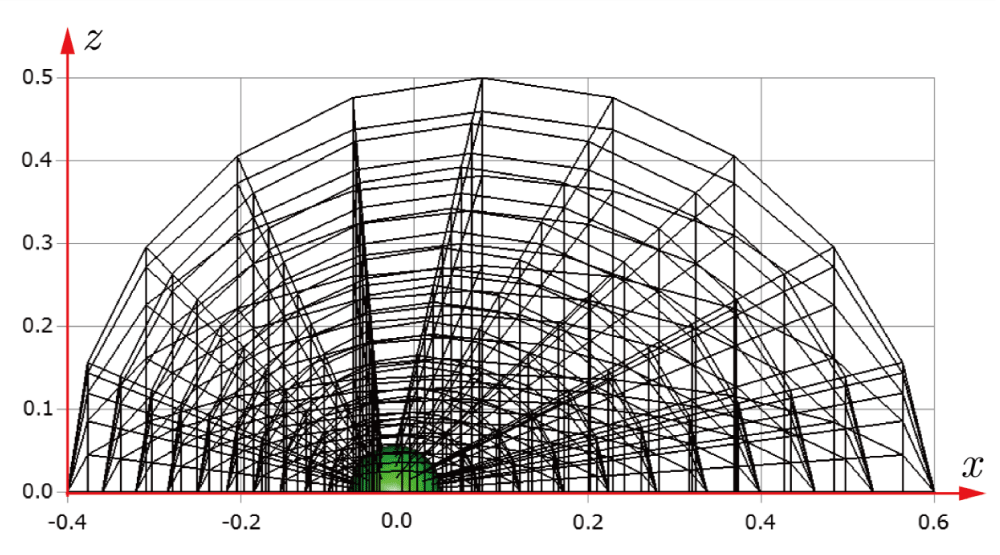
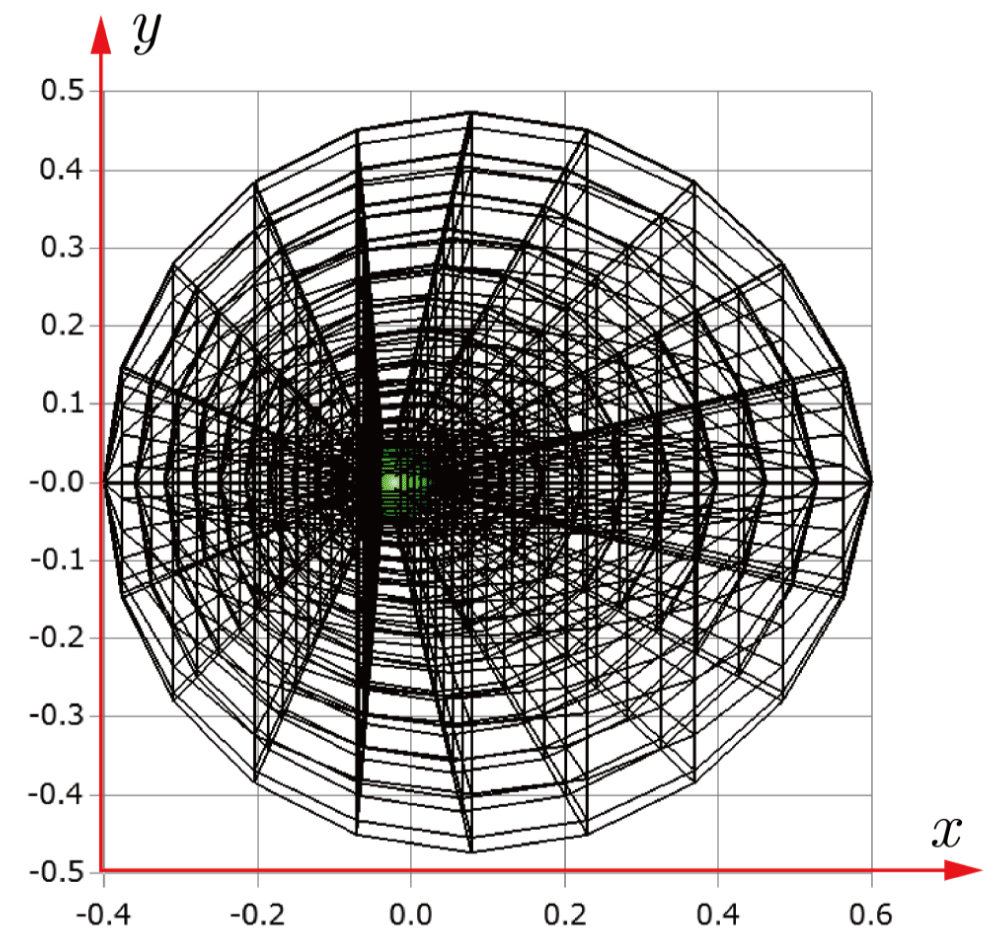
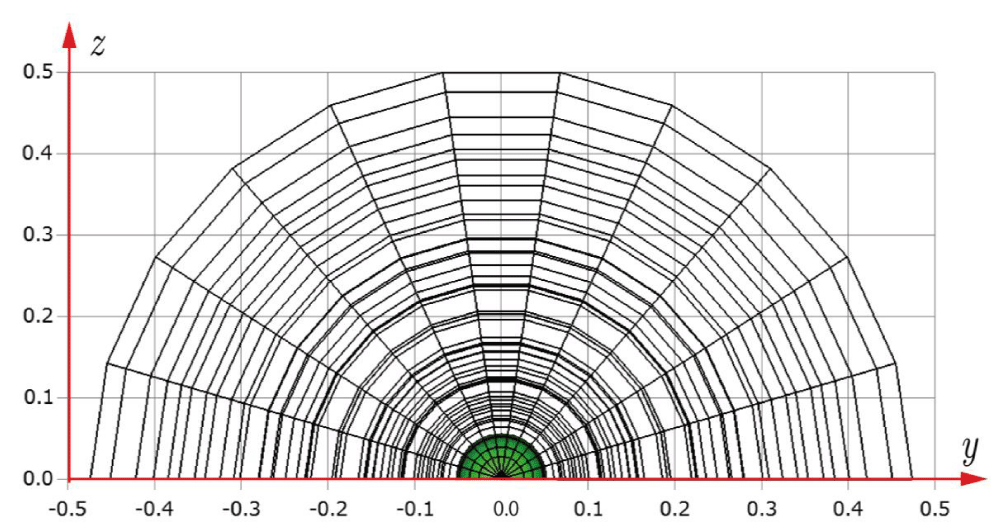
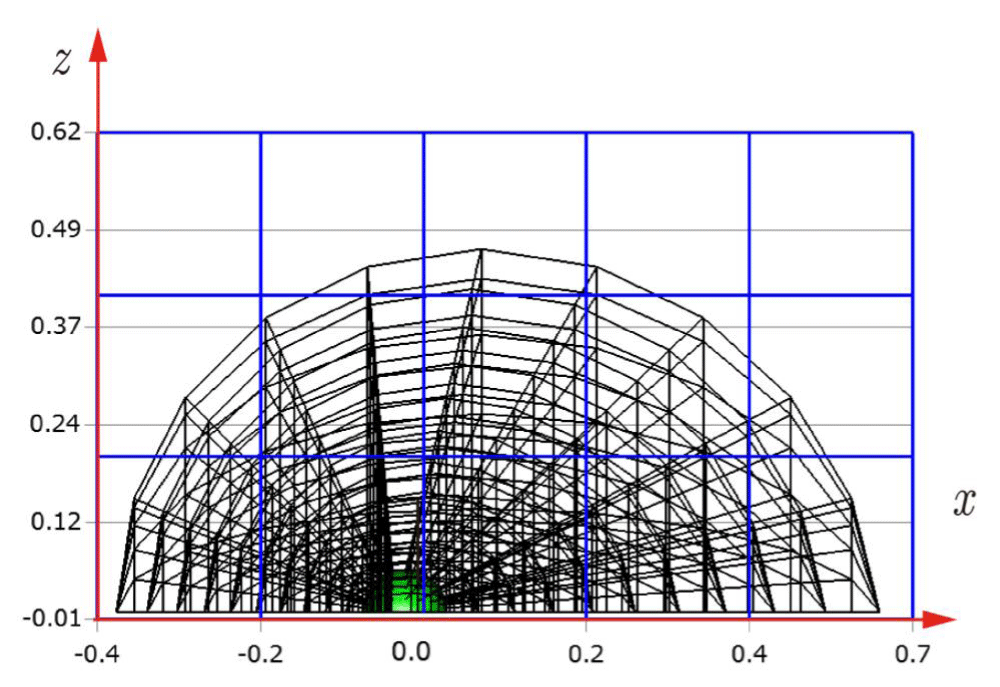
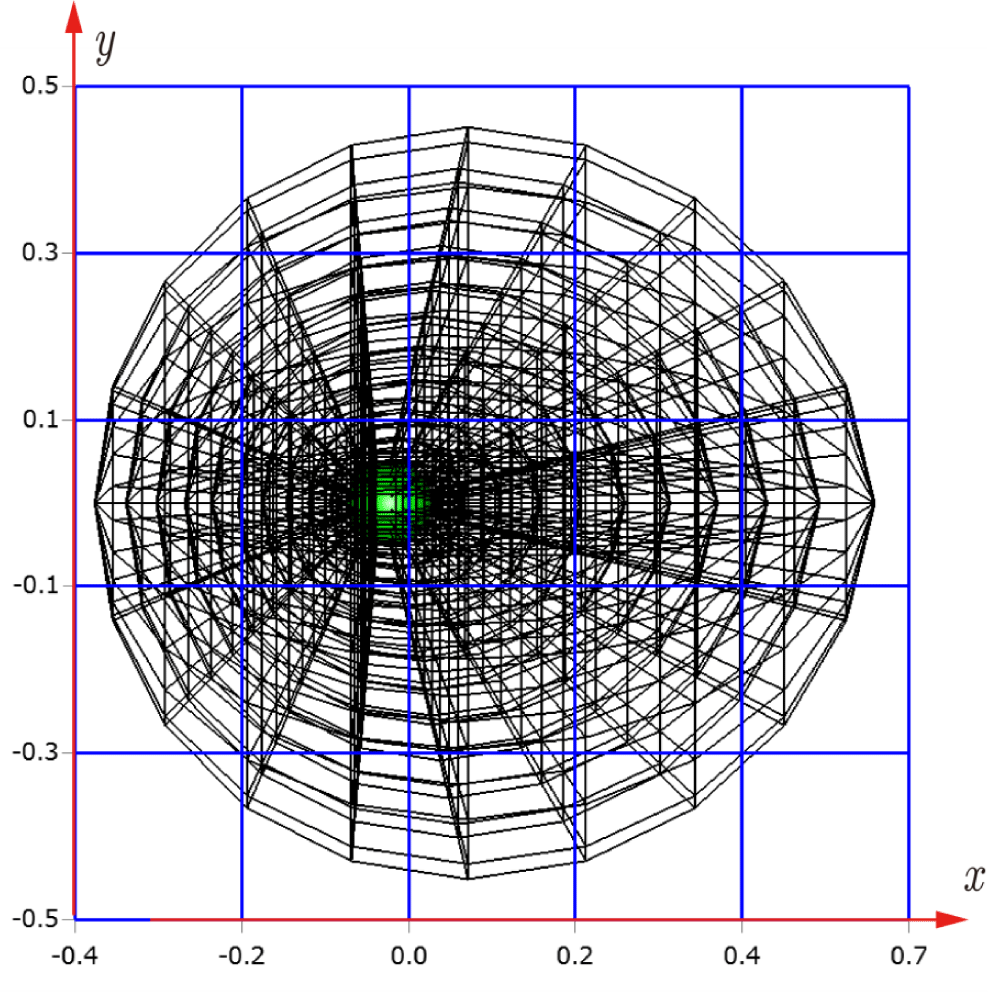
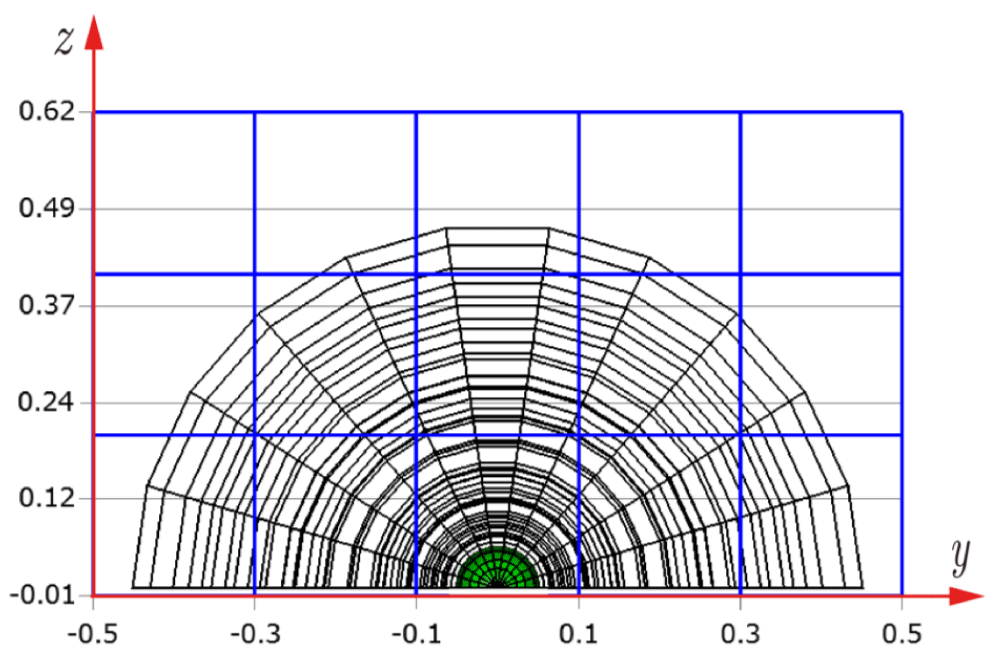
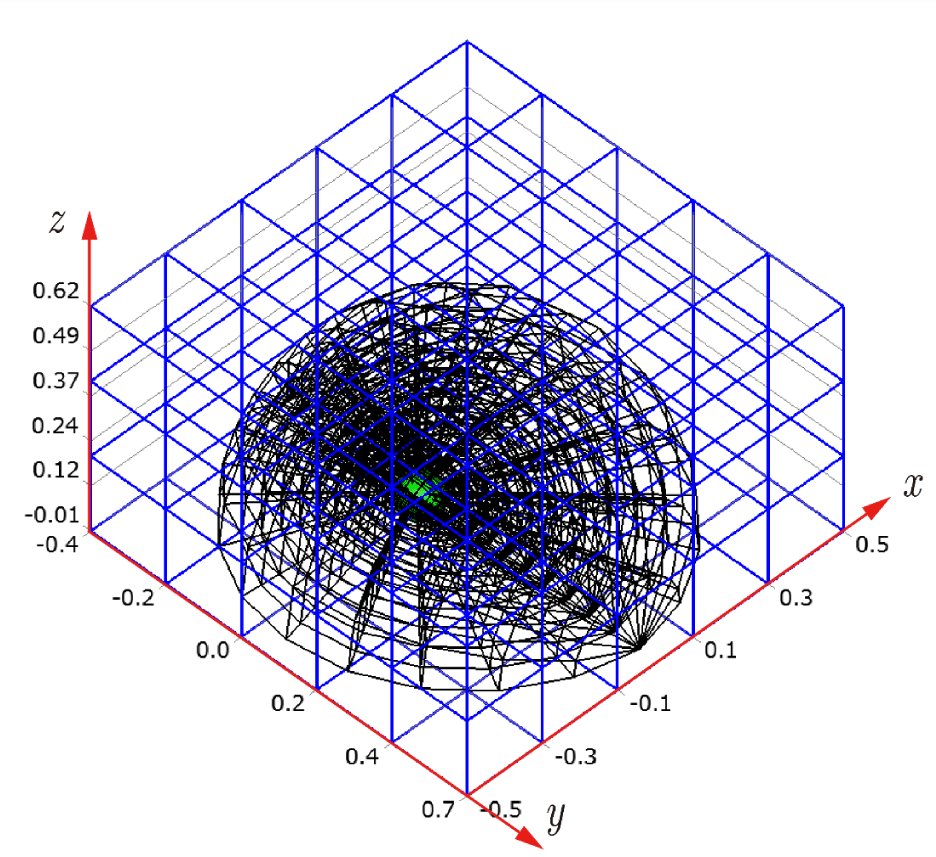
Before explaining the three-dimensional CCR method, a 3D mesh is created around a sphere with a radius of 0.05 m. The process begins by generating a two-dimensional mesh around a semicircle as the base mesh (Figure 1), with intentionally small radial (Nr = 10) and circumferential (Nc = 10) divisions to clearly visualize the cells. This base mesh is then rotated around the x-axis (horizontal axis in Figure 1) to create a rotationally symmetric 3D mesh with 11 circumferential divisions (Nx = 11). The side, top, front, and isometric views are shown in Figures 2-5. Each 3D cell is assigned a number. Periodic boundary conditions are applied in the calculations to perform DSMC simulations over the entire spherical domain. This type of boundary condition is commonly used in fluid dynamics simulations. When a particle exits one side of the computational domain (e.g., the plane at z=0 with y>0), it re-enters from the opposite side (e.g., the plane at z=0 with y<0), effectively causing the domain to "wrap around" on itself.
2.2 Cartesian Cell Registration (CCR) method for three dimensions
References [22,23] introduce the Cartesian Cell Registration (CCR) method for two-dimensional meshes to reduce the number of cells that need to be searched. Before extending this method to three dimensions, we will briefly explain the two-dimensional CCR method.
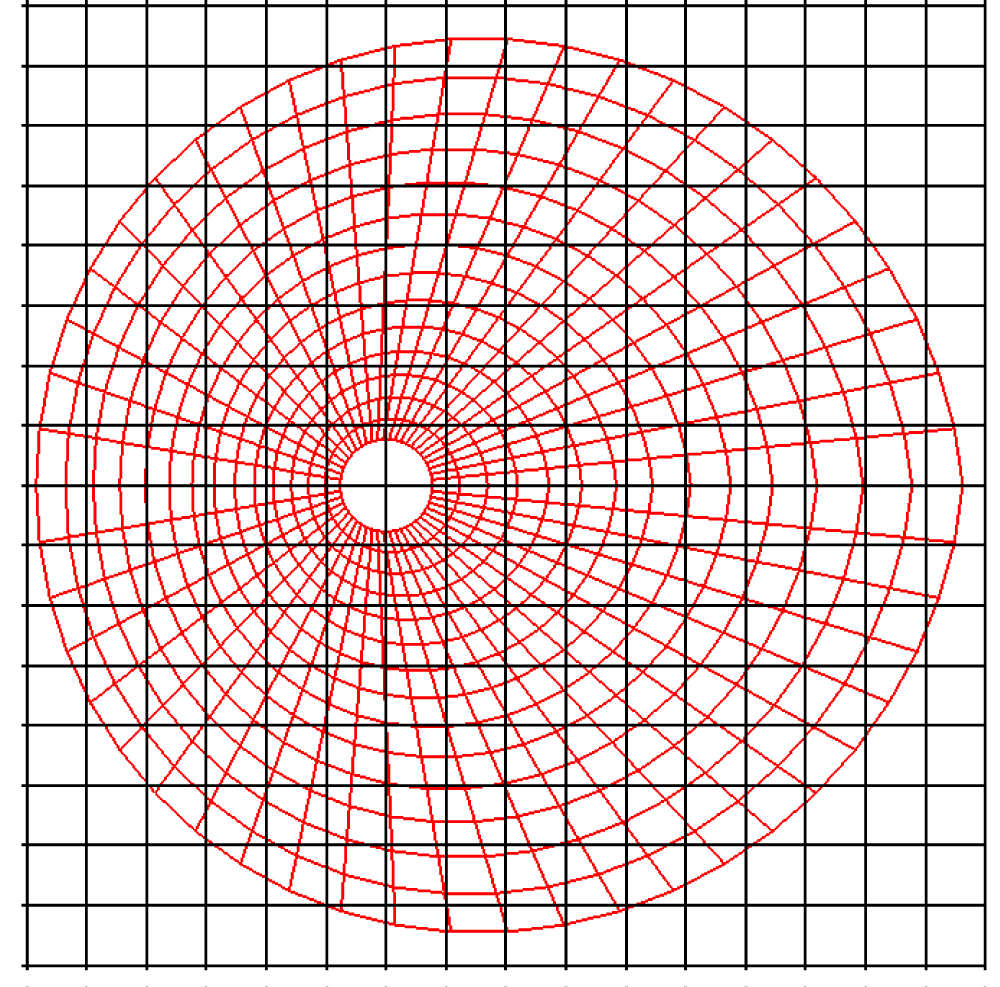
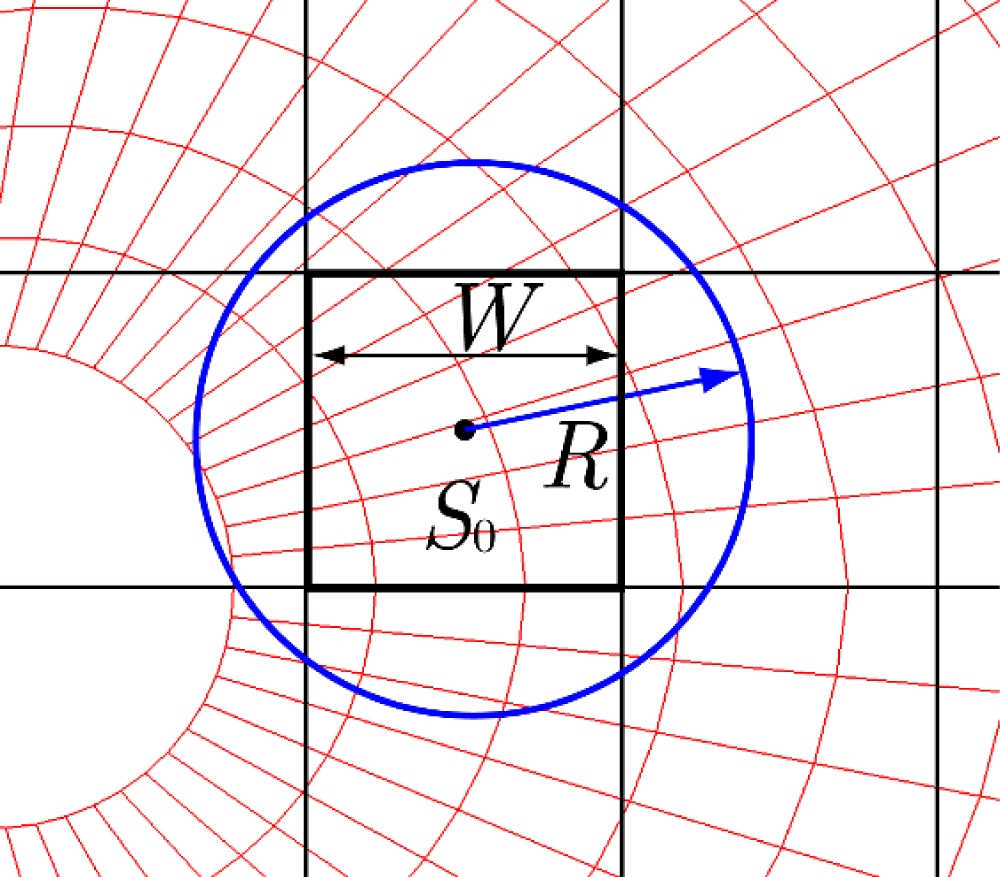
Let us consider a mesh around a circular cylinder (shown in red in Figure 6) to be registered with a Cartesian mesh (black). The target mesh (red) can adopt structured, unstructured, or polygonal configurations, and supports both sequential and arbitrary cell numbering. Consider a square Cartesian cell S0 with a cell width W (Figure 7). All red cells in the target mesh with centers within a distance R from the center of S0 are registered with S0. This process is repeated for all Cartesian cells and target red cells. The Cartesian cell containing a target particle can be identified through straightforward geometric calculations using the particle's coordinates. From there, the corresponding target cell is determined by searching only the cells registered with the Cartesian cell. The cell where the particle exists is then determined using the AC method, as described in Chapter 3.
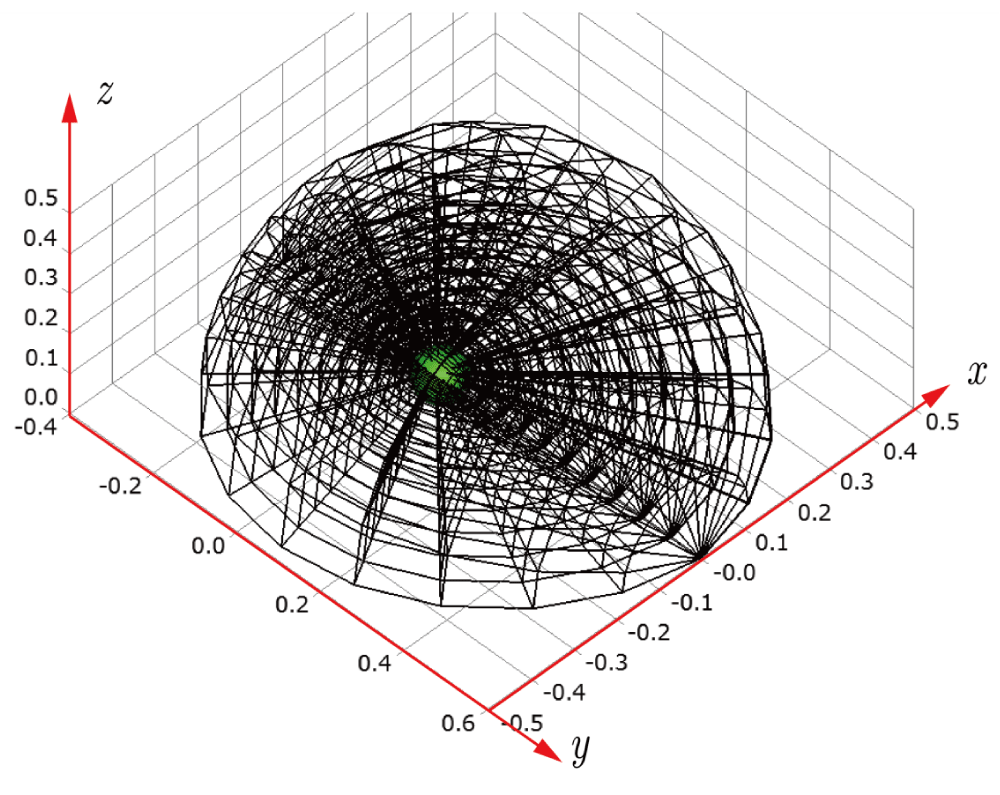
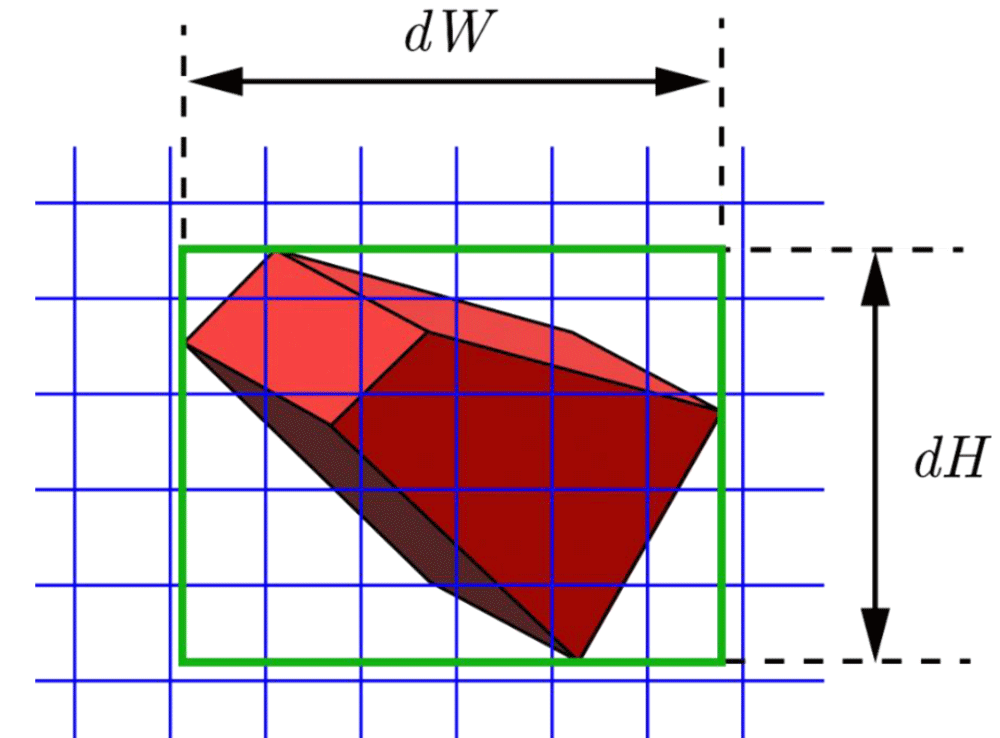
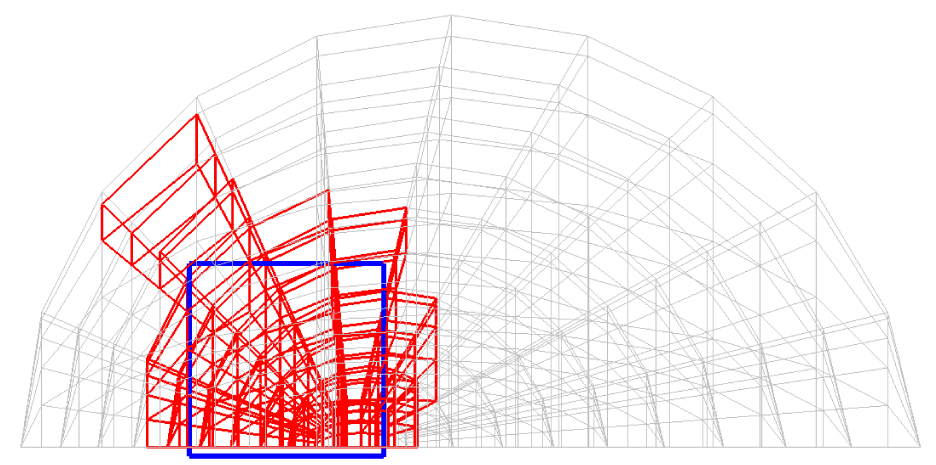
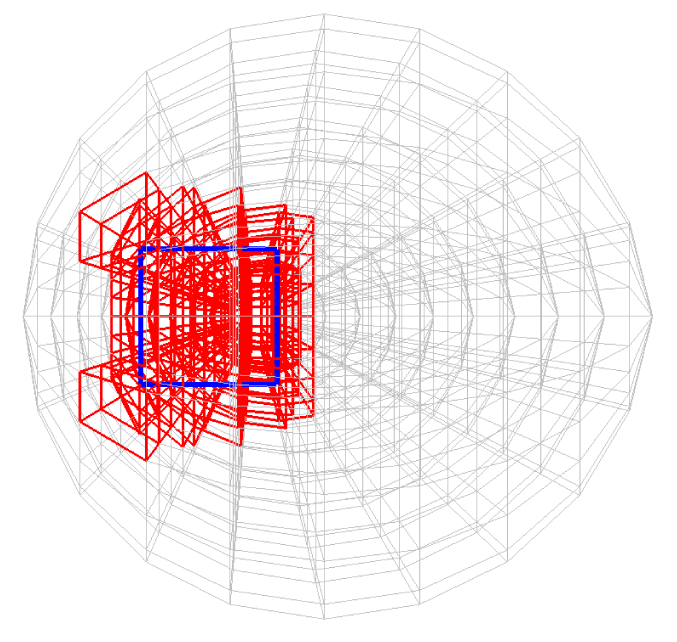
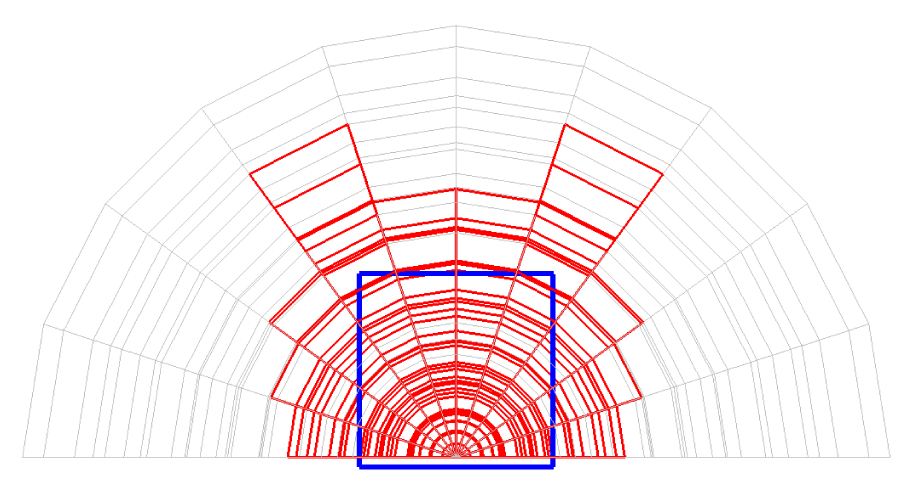
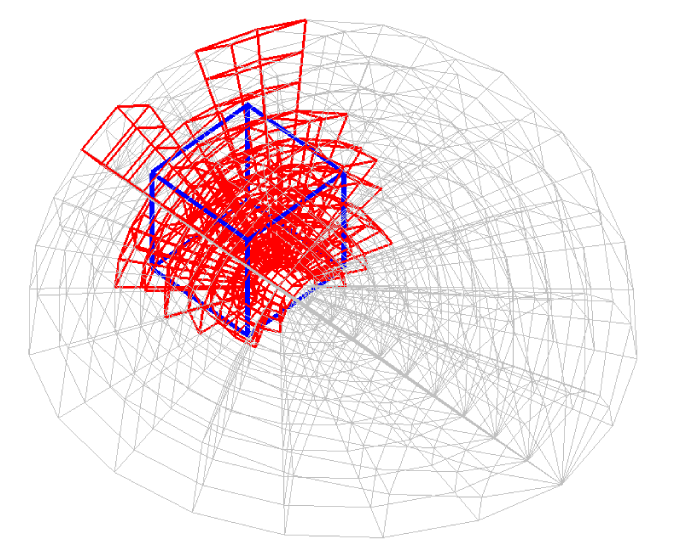
Next, the Cartesian Cell Registration (CCR) method for three-dimension is explained. In Figure 8, a 3D cell (red) of the three-dimensional mesh and the three-dimensional Cartesian cells (blue) are shown. Let the width and height of the projected area of the red cell be denoted as dW and dH, respectively. Similarly, let the depth of this cell be dD (not shown in this figure). Then, this red cell is registered with the Cartesian cells in the box of dW, dH, and dD. While not ideal, the method registers some unrelated Cartesian cells for simplicity are also registered. However, it simplifies the computer algorithm. In a real implementation, dW, dH, and dD are set slightly larger to ensure that every 3D cell in the three-dimensional mesh is registered without fail.
In Figures 9-12, the 3D cells (black) in the three-dimensional mesh, the Cartesian cells (blue), and the hemisphere (green) are shown. For clarity, the size of the 3D cells is intentionally set larger. To demonstrate how the CCR method works, Figures 13-16 show examples of the registered 3D cells (red) within a single Cartesian cell (blue). Note that all red cells are registered with one or more Cartesian cells.
When a particle moves into this Cartesian cell, its location can be easily determined through simple calculations. The target 3D cell where the particle resides is then identified within the red registered cells using the VC method explained in Chapter 3, rather than searching through all 3D cells in the mesh. This significantly reduces the computational time, as demonstrated in Section 4. Note that our method allows the particle to be at an arbitrary position, unlike the conventional methods, which require it to remain within adjacent cells.
The number of registered red cells in the above example is 292. However, as demonstrated in Chapter 4, the optimal average number of registered 3D cells is approximately four, which can be achieved using smaller and more numerous Cartesian cells.
3 Area comparison method and volume comparison method
3.1 Area comparison method for two dimensions
When searching for cells in a two-dimensional region using the CCR method presented in Chapter 2, it is necessary to identify the cell containing the target particle. To facilitate this, the Area Comparison (AC) method was introduced [22,23]. As mentioned in the Introduction, the conventional methods require multiple if-statements, often exceeding the number of edges (2D) or faces (3D) per cell. Moreover, they involve fairly intricate programming that demands carefully analyzing the particle’s geometric relation to cell boundaries. In contrast, the AC method requires only a single if-statement.
Before extending the AC method to three dimensions, the two-dimensional method is briefly explained below.
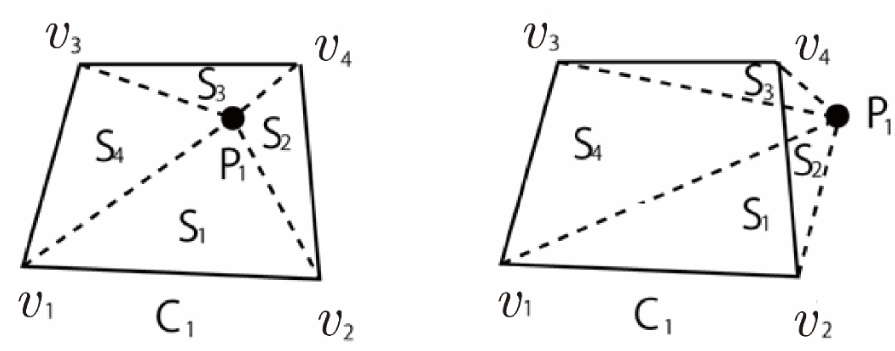
Consider a target particle P₁ and a quadrilateral cell C₁ with area S as shown in Figure 17. Let S₁ be the sub-area of the triangle formed by vertices v₁, v₂ of C₁, and the particle position P₁. Similarly, let S₂, S₃, and S₄ represent the sub-areas of triangles ΔP₁v₂v₄, ΔP₁v₃v₄, and ΔP₁v₁v₃, respectively. The presence of the particle within C₁ can be verified using the following simple condition:
If S = S₁ + S₂ + S₃ + S₄, then the particle P₁ exists within the cell C₁ (Figure 17(a)).
Moreover, if S = S₁ + S₂ + S₃ + S₄ and S₁ = 0, then the particle lies on the edge v₁v₂. Additionally, if S = S₁ + S₂ + S₃ + S₄, S₁ = 0, and S₂ = 0, then the particle is located at vertex v₂. Finally, if S ≠ S₁ + S₂ + S ₃ + S ₄, then the particle lies outside C₁ (Figure 17(b)). This method can easily be extended to any convex polygonal cell.
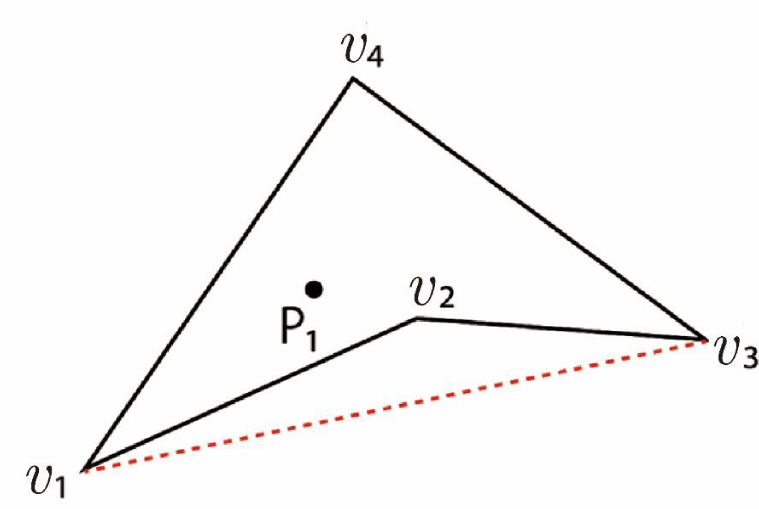
As mentioned in the Introduction, if the cell is concave, the program may risk entering an infinite loop [7]. However, the presence of a particle within a concave quadrilateral cell, as illustrated in Figure 18, can be verified using the following straightforward condition:
If the particle lies within triangle Δv₁v₃v₄ but does not lie within triangle Δv₁v₂v₃, then the particle exists within the concave cell v₁v₂v₃v₄. In the formulation of the AC method, if
ΔP₁v₁v₃ + ΔP₁v₃v₄ + ΔP₁v₁v₄ = Δv₁v₃v₄
And
ΔP₁v₁v₃ + ΔP₁v₂v₃ + ΔP₁v₁v₂ ≠ Δv₁v₂v₃,
then the particle exists within the concave cell v₁v₂v₃v₄.
3.2 Volume Comparison method for three dimensions
The AC method can be easily extended to 3D by comparing volumes instead of areas. This approach is referred to as the Volume Comparison (VC) method, as detailed in the following discussion.
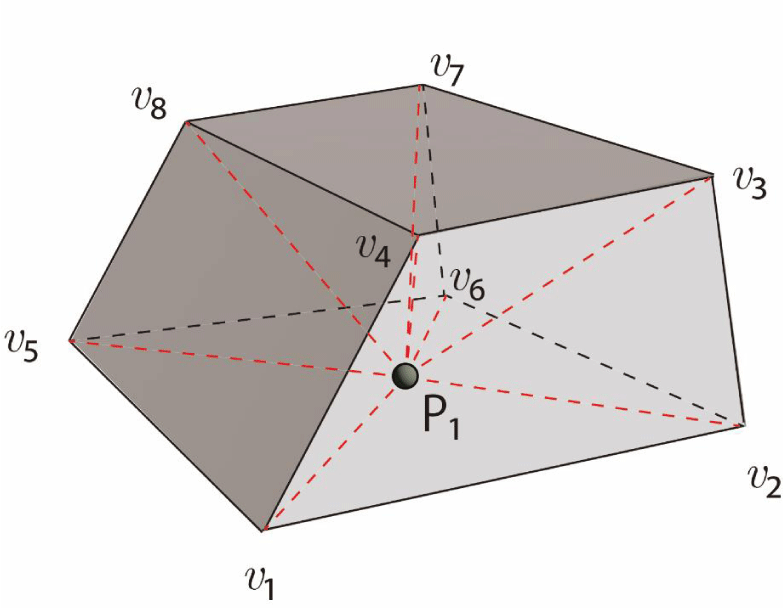
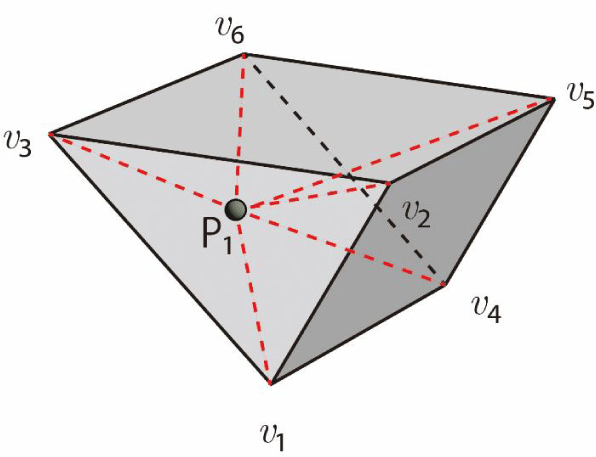
As shown in Figure 19, consider a convex hexahedral cell with vertices v₁ to v₈ and a particle at P₁. Six square pyramids can be created, each with a face as its base and the particle as its apex. Specifically, V0 refers to the volume of the convex hexahedral cell defined by vertices v₁ through v₈, while V1 corresponds to the volume of the square pyramid formed by points P₁, v₁, v₂, v₆, and v₅, and so forth for the subsequent volumes. Apparently, if V1 + V2 + V3 + V 4 + V5 + V6 = V0, then the particle exists within the hexahedral cell. Under this condition:
- If one of the six sub-volumes (V1–V6) equals 0, the particle lies on the base (surface) of the square pyramid.
- If two of the sub-volumes equal 0, the particle lies on an edge of the hexahedral cell.
- If three of the sub-volumes equal 0, the particle lies on a vertex of the hexahedral cell.
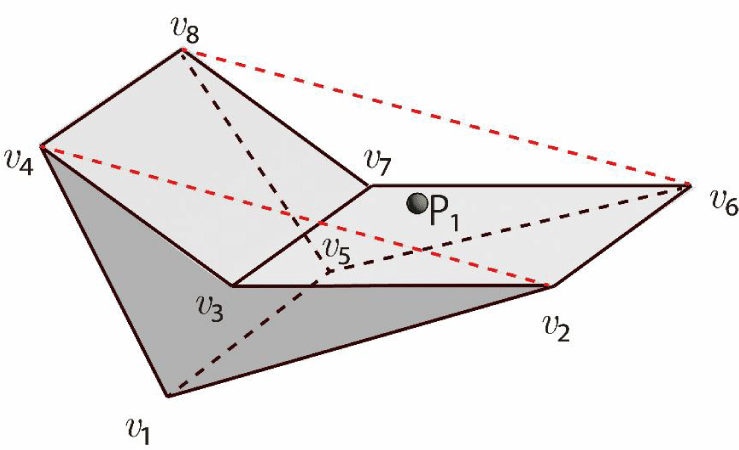
Moreover, as shown in Figure 20, consider a concave hexahedral cell with vertices v₁ to v₈ and a particle at P₁. If the particle is inside the triangular prism formed by the vertices v₁, v₂, v₄, v₅, v₆, and v₈, and if the particle is not inside the triangular region formed by the vertices v₃, v₂, v₄, v₇, v₆, and v₈, then the particle exists within the concave hexahedral cell. The existence of the particle within a triangular prism mentioned above can be verified by comparing the volumes as follows:
A triangular prism with vertices v₁ to v₆ and a particle at P₁ is shown in Figure 21. Let the sub-volumes of two triangular pyramids (the vertices P₁, v₁, v₂, v₃ and P₁, v₄, v₅, v₆) be V1 and V2. Let the sub-volumes of three square pyramids (the vertices P₁,v₁,v₄,v ₆,v ₃, P₁,v₁,v₄,v₅,v₂, and P₁,v₂,v₅,v₆,v₂) be V3, V4, and V5, respectively. The volume of the entire triangular prism is V0. The particle exists inside the triangular prism if the following condition holds:
V1 + V2 + V3 + V4 + V5 = V0.
The VC method readily generalizes to any polyhedral geometry, not just those shown here, including concave hexahedral cells, which may cause the program to enter an infinite loop [7]. Note that when the area (in 2D) or volume (in 3D) is very small or slender, the computational results may be susceptible to errors. However, such issues are also likely to occur in the conventional methods.
In this section, we have introduced the VC method for three dimensions and the concept of handling concave cells using the VC method. In the next chapter, the computational results and evaluation for convex cells in a 3D mesh, as shown in Figure 2-5, will be presented, while those for concave cells will be discussed in a future paper.
4. Computational results and evaluations
4.1 Comparison with other simulations
Before evaluating the computational efficiency of the CCR and VC methods, we compare the results of our DSMC simulation with those of [24] using identical parameters: neon as the gas, Mach number Ma = 2, rarefaction parameters δ = 1 and δ = 30, and a free-stream temperature T = 300 K. For our simulations, the number of radial divisions is Nr = 40, the circumferential divisions are Nc = 50, and the axial divisions are Nx = 15, resulting in a total cell count of 30,000. Our computer is equipped with an Intel Core i9-14900KF CPU (3.2–6.0 GHz) and 128 GB of memory. No parallel computing nor large-scale computations were performed.
- The stability criterion for the DSMC (Direct Simulation Monte Carlo) method differs from classical numerical stability conditions such as the Courant–Friedrichs–Lewy (CFL) condition used in conventional CFD. To ensure stable and accurate DSMC simulations, the following guidelines should be followed:The time step Δt must be significantly smaller than the local mean collision time τ to prevent multiple collisions within a single time step.
- The computational cell size Δx should be smaller than or comparable to the local mean free path λ, ensuring that collisions occur only between nearby particles.
- Each cell should contain a sufficient number of particles—typically at least 10 to 30—to provide statistically meaningful collision sampling.
- Particle displacement within a time step should be smaller than the cell size, i.e., particles should not travel farther than one cell in a single time step.
Furthermore, the statistical error scaling for DSMC, as discussed in [2], demonstrates the characteristic behavior of statistical noise, where N is the number of simulated particles. In our simulations, the total number of particles is approximately 1.3 million, which is sufficient to ensure a low level of statistical error.
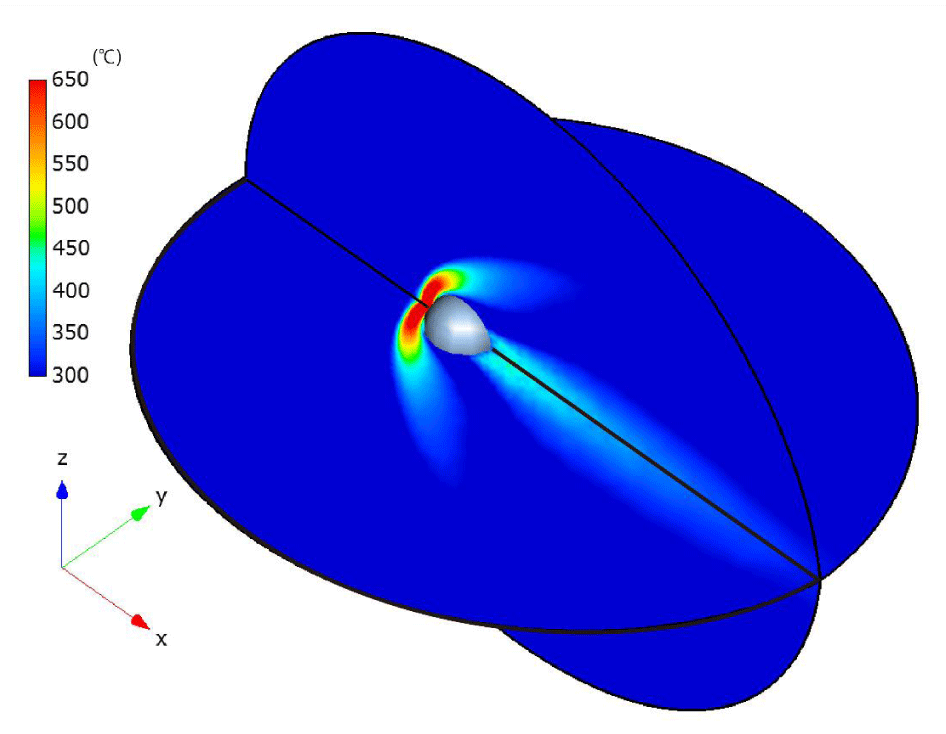
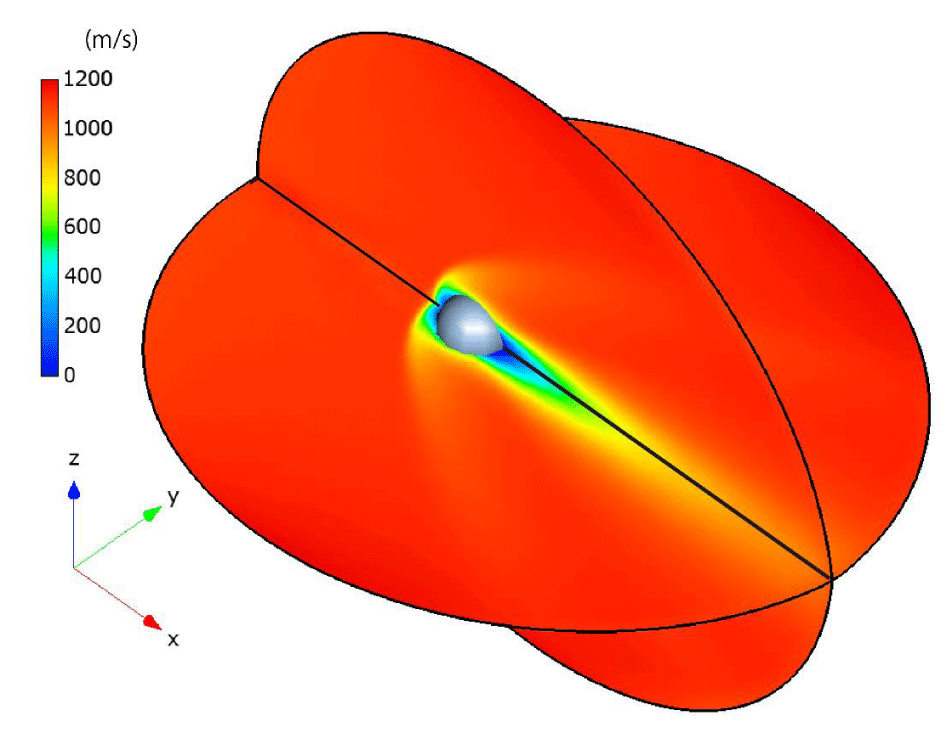
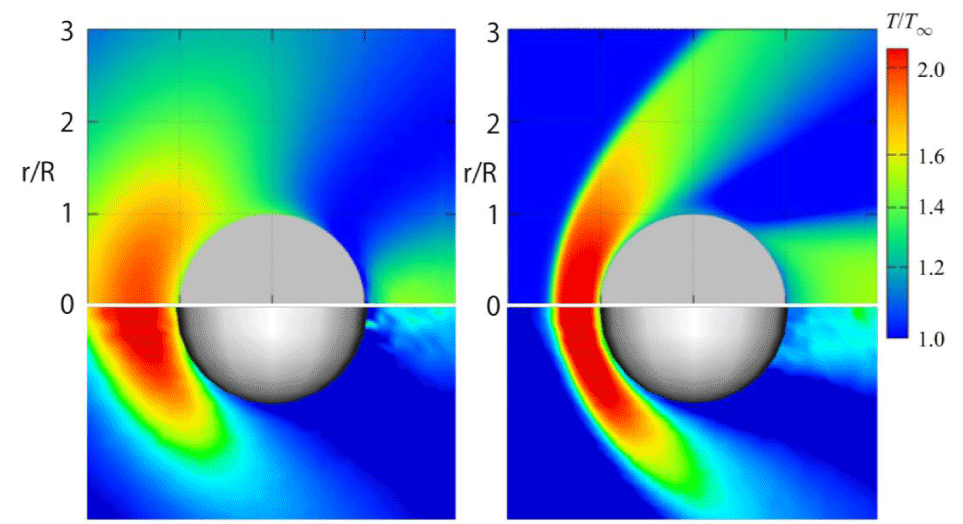
In Figures 22,23, the steady-state temperature and velocity distributions at δ = 30 are presented on the x-y plane and x-z plane, respectively. In Figures 24, comparisons of the temperature distributions from [24] (upper) and our results (lower) at δ = 1 and δ = 30 demonstrate good agreement. Specifically, in both cases, when the rarefaction parameter is smaller (δ = 1), the high-temperature region in front of the sphere becomes thicker along the x-direction and narrower along the y-direction. In contrast, for a larger rarefaction parameter (δ = 30), the high-temperature region becomes thinner in the x-direction and broader in the y-direction.
The observed differences—specifically, the coarser temperature distribution downstream of the sphere in our results compared to those of [24]—may be attributed to the smaller number of particles and cells used in our simulations, as well as the size of the computational regions. However, since the primary objective of this paper is to demonstrate the computational efficiency of the CCR and VC methods rather than to improve computational accuracy, this discrepancy is considered acceptable.
This section focuses on validating our simulation results rather than comparing computational efficiency. An estimation of computational cost between the CCR and VC methods and the conventional methods is provided in Section 4.4.
4.2 Computational efficiency of the CCR method and VC method
To examine the computational efficiency, or the speed-up ratio, of the CCR and VC methods, the following simulations were conducted.
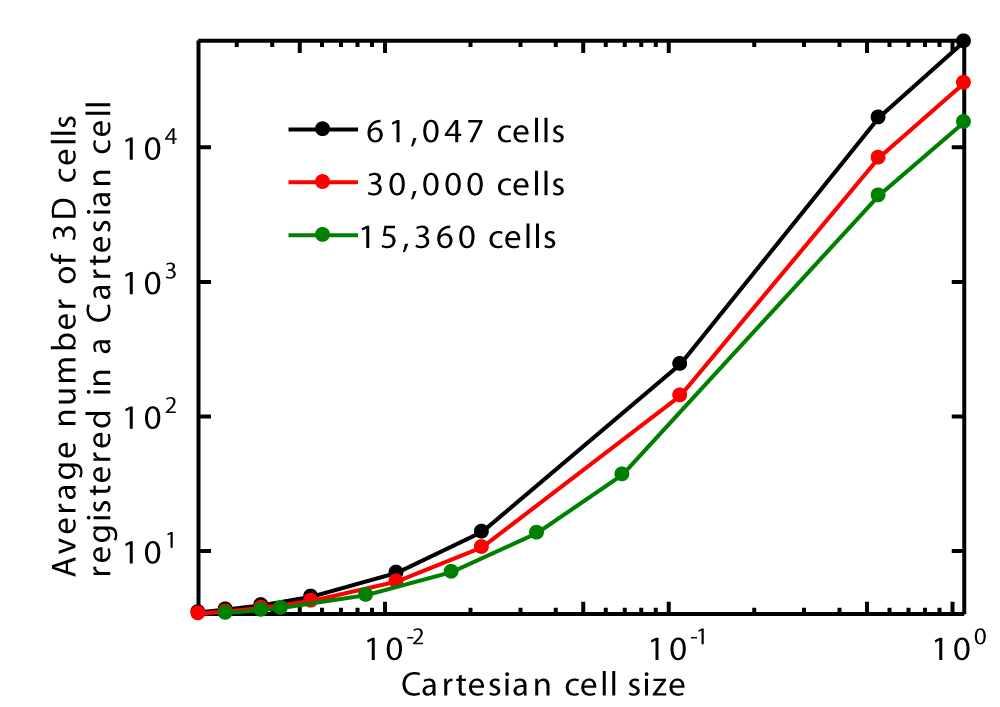
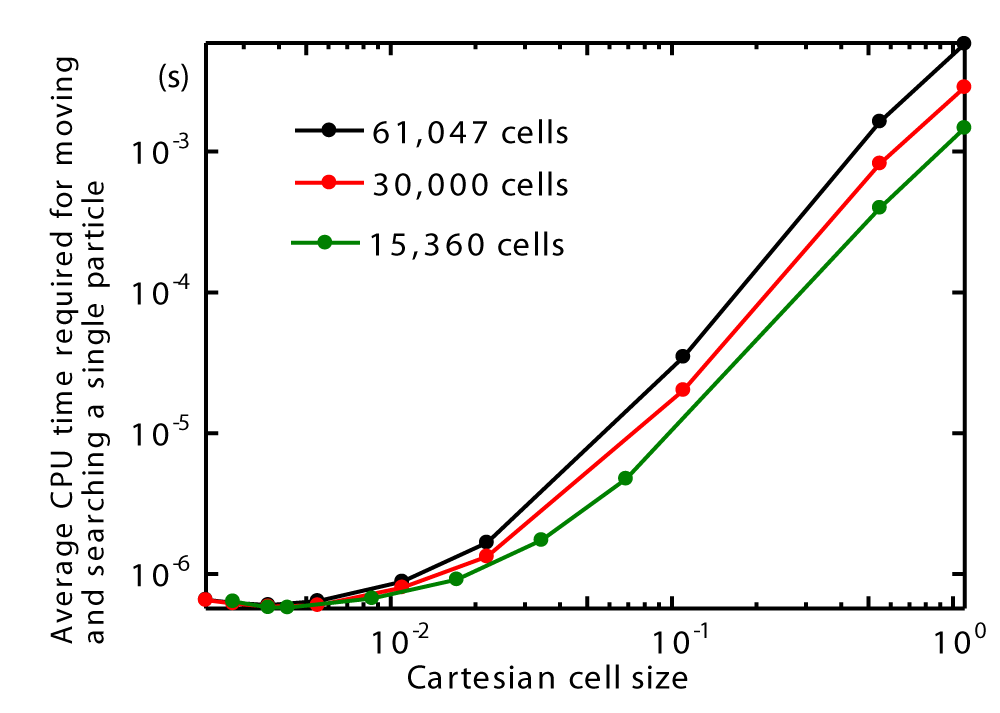
A three-dimensional mesh around a sphere was created using the parameters Nr = 51, Nc = 63, and Nx = 19, resulting in a total cell count of 61,047. The three-dimensional Cartesian cells, within which the cells around the sphere are registered, are all cubic. The edge size of a Cartesian cell ranges from 2.2 × 10⁻³ m to 1.1 m, as shown in Table 1. When the edge size is as large as 1.1 m, all cells around the sphere are registered within a single Cartesian cell. As the edge size of the Cartesian cell decreases, the average number of registered 3D cells within each Cartesian cell also decreases, which in turn reduces the number of cells to search and lowers the CPU time required for particle searching.
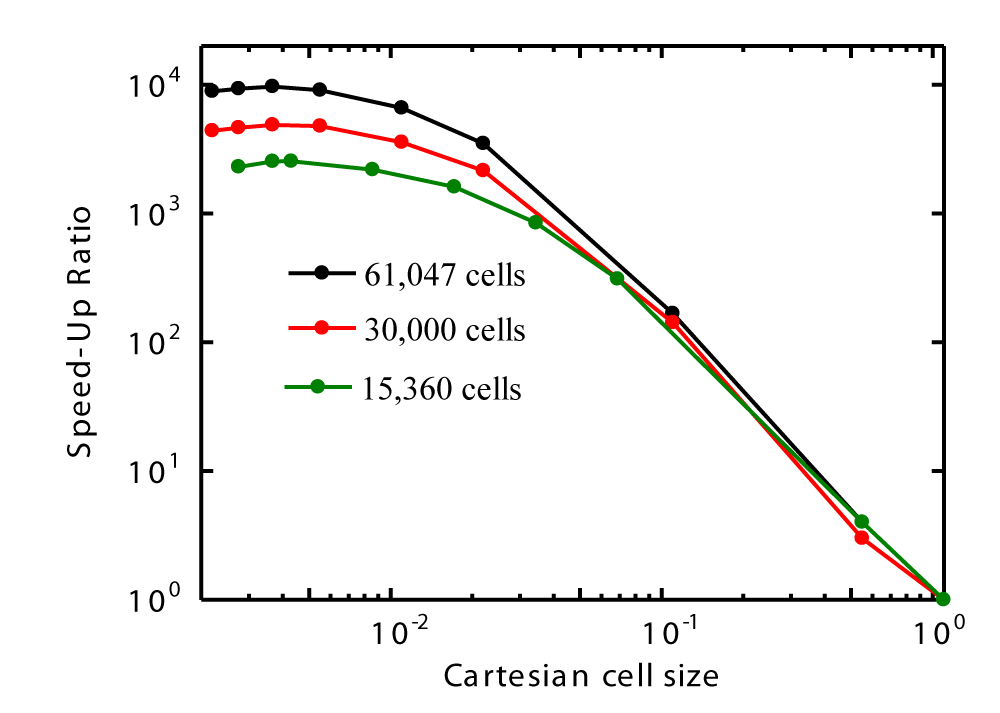
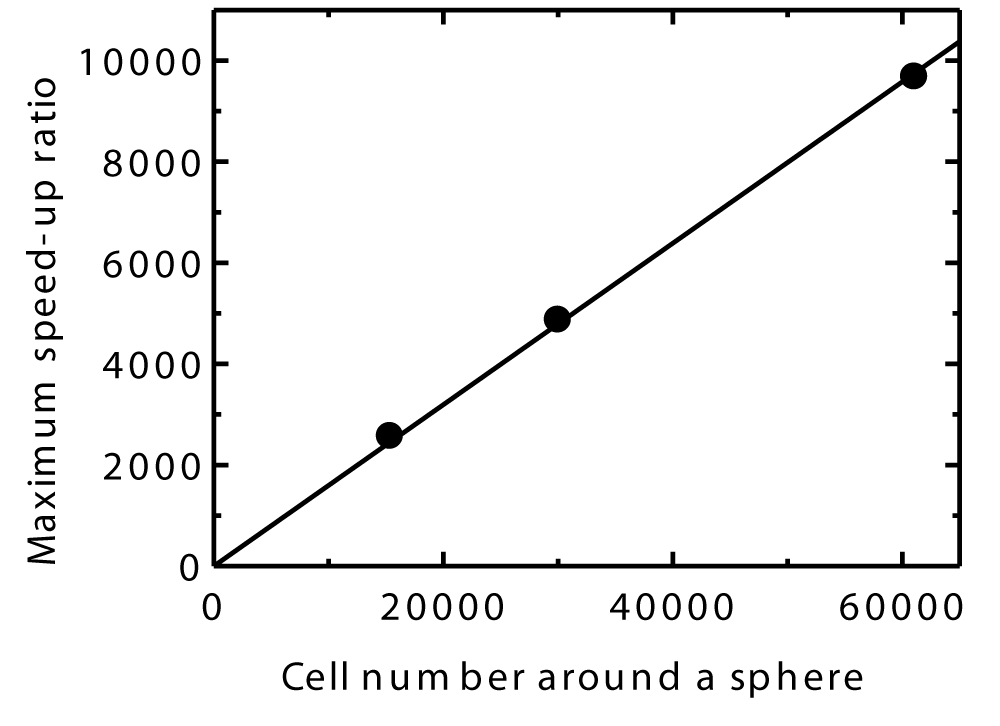
When the edge size is 1.1 m (where all cells around the sphere are registered within a single Cartesian cell), the average time for the movement and searching of a single particle is considered equivalent to that of the brute-force method. This brute-force approach serves as a benchmark scenario where no speed-up techniques are applied. The speed-up ratio is defined as the time taken by the brute-force method divided by the time required when using smaller Cartesian cell sizes. For each simulation, the total number of particles is approximately 1.3 million. Consequently, the maximum speed-up ratio is obtained as 9,675 when the average number of registered 3D cells in a Cartesian cell is 3.95.
The comparison with another benchmark, specifically the conventional methods, is discussed in Section 4.4.
Tables 2 and 3 also present the results for fewer three-dimensional cells around a sphere with the following parameters: Nr=40, Nc=50, and Nx=15, resulting in a total cell count of 30,000, and Nr =32, Nc =40, and Nx =12, resulting in a total cell count of 15,360. The maximum speed-up ratio is observed at Cartesian cell sizes of 3.67 × 10⁻³ m and 4.30 × 10⁻³ m, respectively, with the average number of registered 3D cells in a Cartesian cell being 3.78 (former) and 3.77 (latter).
Figures 25 shows that the average number of 3D cells registered in a Cartesian grid increases as the size of the Cartesian cells increases for three different 3D cell counts around a sphere. Additionally, for a given Cartesian cell size, the average number of registered 3D cells increases with the 3D cell count around the sphere.
Figures 26 also illustrates that the average CPU time for moving and searching a single particle decreases with decreasing Cartesian cell size but increases with higher cell counts around the sphere. Moreover, Figures 27 presents the speed-up ratio as a function of Cartesian cell size. It is observed that the maximum speed-up ratio occurs for all three cell counts around the sphere.
Finally, Figures 28 shows that the maximum speed-up ratio increases linearly with the cell number around the sphere. This demonstrates that the efficiency of the CCR and VC methods increases with the number of cells and suggests they will be more efficient in larger-scale three-dimensional DSMC simulations compared to those in this study.
4.3 Effect of cartesian cell size on algorithm efficiency and computational performance
The efficiency of the algorithm depends on the Cartesian cell size—that is, the average number of registered 3D cells within a Cartesian cell. It is assumed that the optimal Cartesian cell size should be as small as possible, ideally containing only a single registered 3D cell—although this may not always be feasible. In such a case, each Cartesian cell would lie entirely within a single 3D cell and could be identified based on the particle's position using simple arithmetic calculations. Consequently, the corresponding 3D cell could be identified directly, eliminating the need for search operations, as only one 3D cell is registered within each Cartesian cell. However, if the Cartesian cells are large and contain multiple registered 3D cells, search time increases. In the extreme case where a Cartesian cell is large enough to encompass all 3D cells, the method essentially reverts to a brute-force search, as previously explained. In these simulations, the minimum computation time occurs when the average number of registered 3D cells within a Cartesian cell is approximately four instead of one, which was noted earlier. This may be because, as Cartesian cell count increases, memory usage and access time rise accordingly.
Furthermore, in these simulations, the ratio of the maximum to minimum 3D cell volume sizes is approximately 26,000. This demonstrates that the CCR method is capable of handling unstructured meshes with substantial variations in cell size.
4.4 Comparison of the CCR and VC methods with conventional methods
Although the conventional methods are not used in this paper, their computational cost can be estimated as follows.
Since the computational cost of calculating sub-areas (sub-volumes) in the AC (VC) method is comparable to that of evaluating edge (face) products in the conventional methods, the primary factor influencing computational cost is the number of cells that need to be checked. In the conventional methods, the cells checked for the presence of a particle that has moved during a small time step are the adjacent cells of the one where the particle was previously located. For example, the number of cells to check is 9 in a 2D mesh (Figure 1) and 27 in a 3D mesh (Figures 2-5), including the cells that contain the original positions of the particles. Note that these values represent the maximum number of attempts required for particle search; however, in most cases, the particle is found before reaching this limit.
As demonstrated, the number of cells in a 3D mesh varies depending on the size of the Cartesian grid cells. The optimal number of cells is found to be around 4, which is smaller than 29 in the conventional methods, as mentioned above. As shown in Table 1, when the average number of registered 3D cells per Cartesian cell is 23.91—close to the 29 in the conventional methods; the speed-up ratio is 2172. The maximum speed-up ratio reaches 9675 when the average number of registered cells is 3.95. This indicates that our method is approximately 4.45 times faster than the conventional methods, based on the ratio 9675 to 2172. Similar ratios can be derived from Tables 2 and 3, where the values are 4873/973 = 5.01 and 2546/474 = 5.73, respectively. Note that the number of cells to check is unlikely to increase in our method, even for 3D cells with a large number of faces, whereas it increases in the conventional methods.
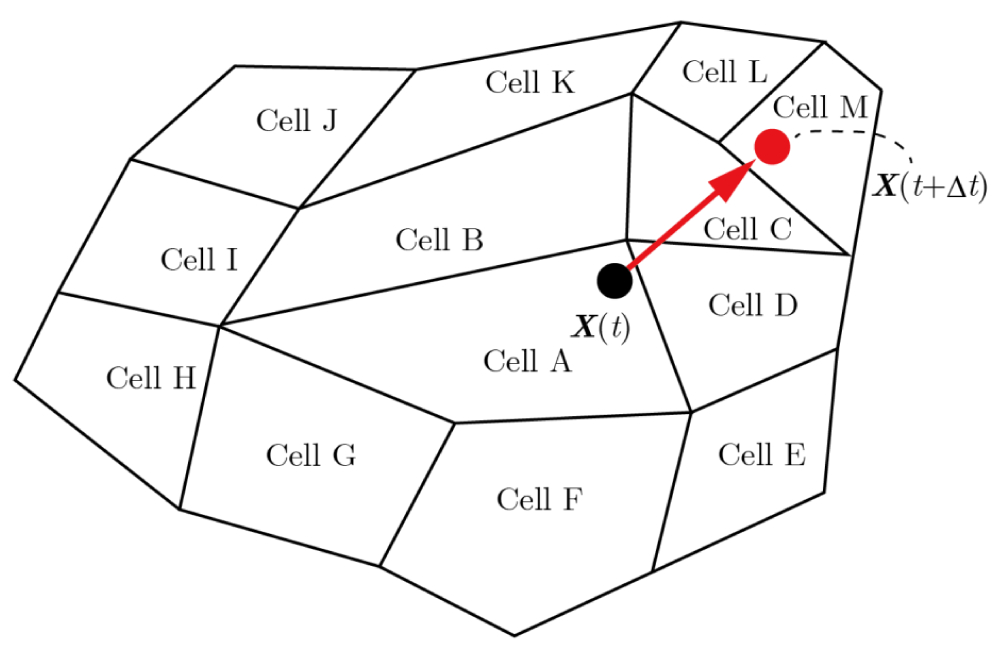
Our method also enables longer time steps, unlike conventional methods, as it permits particles to move beyond adjacent cells, further reducing the overall computational cost. If a particle is near the edge or vertex of a cell, there is a high likelihood that it will move beyond adjacent cells, even with a small time step. This is illustrated in Figure 29, where a particle initially at X(t) in Cell A moves directly to Cell M within a single time step. In the conventional methods, the particle from Cell A is first searched for in the adjacent cells (Cells B–I). If it is not found, the search extends to the next set of adjacent cells (Cells J–M), increasing computational cost. To avoid this repeated search, the time step must be reduced—sometimes more than necessary—which can significantly increase overall computational time. However, our method seamlessly handles particles moving beyond adjacent cells, eliminating the aforementioned time step restriction and thereby reducing the overall computational cost.
5. Auxiliary considerations
In this chapter, only the concept of obtaining the residence time of a particle in each cell it crosses and that of performing calculations with a moving mesh using the CCR and AC methods are introduced. The actual computations using these methods will be presented in a future paper.
5.1 Residence time of a particle in each cell it crosses
As mentioned in the Introduction, determining the particle's residence time in each cell it traverses is essential to compute source terms in gas-phase multiphase flow equations. This section explains the method in two dimensions, with its extension to three dimensions being straightforward.
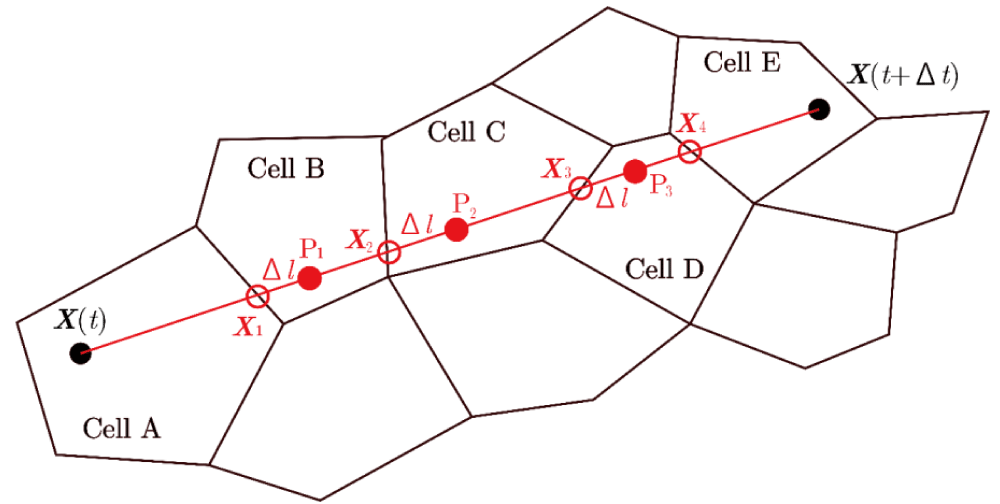
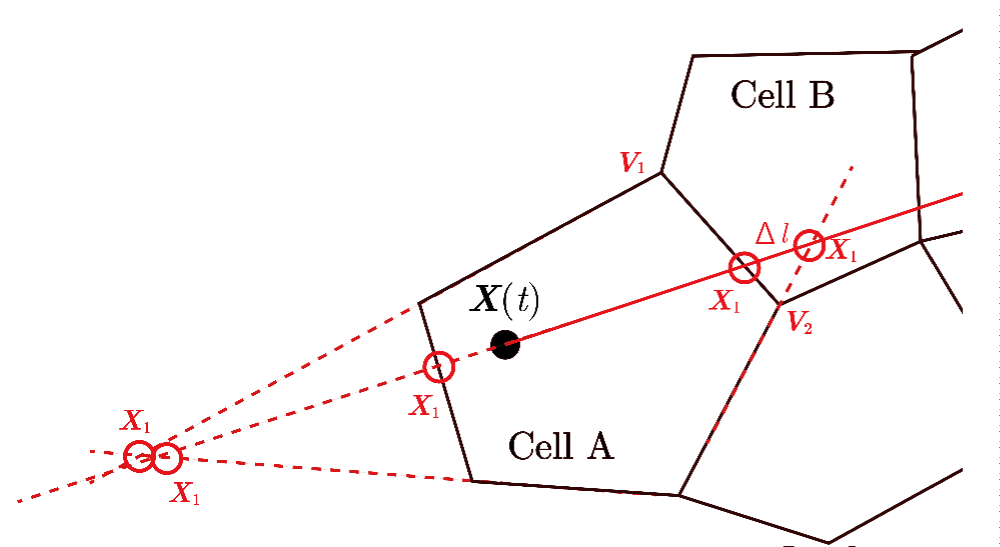
As shown in Figure 30, a particle at time t is located at position X(t) in Cell A and is transferred to position X(t+Δt) in Cell E after a relatively large discrete time interval Δt. The cell numbers for A and E can be identified using the CCR and AC methods. The path of the particle is represented by the line segment and the intersection point X1 with the vertex of Cell A is determined via geometric calculations. Although there are five intersection points between this path and the cell’s vertices or their extensions or the extensions of the vertices of pentagon Cell A, as indicated by the red circles in Figure 31, the intersection point at vertex is the one where either the area or condition is satisfied.
The cell number of Cell B can be determined using the CCR and AC methods for an imaginary particle placed at P1 in Figure 30, which is located at a small distance Δl from the intersection point X1 toward X(t+Δt) on the line segment . By repeating this process until the final Cell E, the path segment crossing each cell and the particle's residence time in each traversed cell can be determined.
5.2 Moving mesh
In this section, the CCR and AC methods are explained for use even when the mesh is moving or deforming. The method is described in two dimensions, and its extension to three dimensions is straightforward.
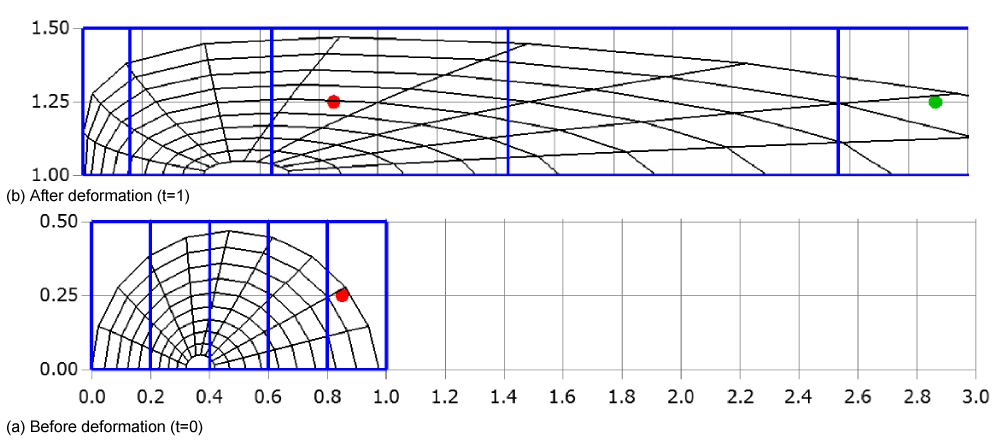
In almost all cases, a moving mesh is described by mathematical equations, such as and , where x and y denote the coordinates of 2D cells vertices at time t, and ξ and η are computational coordinates. This formulation allows for the mapping between the computational domain and the physical domain, facilitating the simulation of dynamic meshes in numerical analyses. For example, consider a simple case where the two-dimensional mesh moves or deforms only in the x-direction, described by the equation . In Figure 32(a), the two-dimensional mesh around a semicircle (black), the Cartesian mesh (blue), and a particle (red) at time 0 are shown. Additionally, Figure 32(b) displays the meshes and the particle at time t = 1. To demonstrate the validity of our methods, a large deformation is intentionally introduced. It can be observed that the meshes are compressed for small x -coordinates and expanded for large x-coordinates. Even though the Cartesian cell width varies with x -coordinates, the CCR method can still be applied to this deformation, as detailed in the following discussion.
In this example, the initial coordinates of the particle are , and the width of the Cartesian cell is Δx = 0.2. This gives the Cartesian cell number as . Therefore, the cell containing the particle can be identified by examining the cells registered with the fifth Cartesian cell from the left.
After deformation, the Cartesian cell number can be determined using the inverse function of , namely, . The Cartesian cell number is then given by:
This means that the Cartesian cell registration remains valid even after mesh deformation. Instead, the initial information of the CCR method can still be used after the mesh deformation. Therefore, the cell containing the particle at t =1 can be identified by examining the cells registered with the third Cartesian cell from the left. This method can be extended to simultaneously account for deformation in both the y- and z-directions.
Importantly, this method imposes no restrictions on particle movement across multiple cells. This addresses a limitation noted in [7], where particle movement was restricted. As shown in Figure 32(b), the particle can be regarded as moving from the green circle, which represents the transferred particle with the mesh, to the red circle, crossing multiple cells.
6. Conclusion
The contributions and key findings of the CCR and VC methods highlighting key advantages over conventional approaches:
- Simplified Implementation: When implementing particle search code from scratch, the VC method significantly simplifies the process compared to the conventional methods because it requires only a single if-statement per search, whereas the conventional methods require more than the number of edges (in 2D) or faces (in 3D) per cell. Additionally, they involve moderately intricate calculations that demand careful consideration of the geometric relationship between the particle’s position and edges or faces.
- Optimized Search Efficiency: The CCR method reduces the number of cells that need to be searched for particles. In a 3D mesh, this number depends on the Cartesian grid cell size, with the optimal number found to be around four—significantly fewer than the 27 required in the conventional methods for our 3D mesh. As a result, computational efficiency improves. Additionally, even for 3D cells with a large number of faces, the number of cells to check remains relatively stable in our method, whereas it increases in the conventional methods.
- Elimination of Time Step Constraints: By combining the CCR and VC methods, the traditional time step restriction in the conventional methods—requiring it to be small enough to prevent a particle from moving beyond adjacent cells—is eliminated. This allows for larger time steps, thereby significantly enhancing computational performance.
- Computational Speed-Up: By integrating the CCR and VC methods, achieves a 9,675-fold speed-up over brute-force methods with 61,047 computational 3D cells. Additionally, the reduced number of cells that must be searched indicates that our method is approximately 4.45 to 5.73 times faster than the conventional methods. Furthermore, as mentioned above, since the time step can be larger than in the conventional methods, overall computational demands can be significantly reduced.
- Handling Diverse Geometries: The CCR method efficiently handles unstructured meshes with varying cell sizes, and the VC method effectively processes concave hexahedral cells without risking infinite loops. It also enables efficient residence time computation by analyzing particle trajectories and their intersections with cell boundaries. These techniques effectively manage moving or deforming meshes without necessitating re-registration of cells, utilizing the inverse deformation function to ensure robustness.
Additionally, when the area (in 2D) or volume (in 3D) of a cell is very small or geometrically slender, the computational results may become prone to numerical errors. However, such issues are not unique to the present method and are also commonly encountered in the conventional approaches. As mentioned earlier, challenges—including handling concave cells, accurately computing the residence time of particles within each crossed cell, and implementing moving meshes will be addressed in future work.
By striking a balance between accuracy and computational efficiency, the VC and CCR methods demonstrate high effectiveness in complex simulations that require precise particle search and positioning within complex three-dimensional environments. These methods offer wide applicability, particularly in domains such as the study of rarefied gases, the behavior of solvents, and the dynamics of diesel sprays in internal combustion engines. Additionally, they play a crucial role in modeling molecular interactions in nanoscale fluid flows, analyzing the movement of granular materials, and solving the gas-phase equations governing multiphase flow dynamics. Their versatility and computational efficiency make them indispensable tools for tackling intricate physical and engineering challenges.
The author gratefully acknowledges financial support from Ritsumeikan University.
- Bird GA. Direct simulation and the Boltzmann equation. Phys Fluids. 1970 Nov;13(11):2676–81. Available from: https://doi.org/10.1063/1.1692849
- Bird GA. Molecular gas dynamics and the direct simulation of gas flows. Oxford: Oxford University Press; 1994. Available from: https://doi.org/10.1093/oso/9780198561958.002.0001
- Bird GA. The DSMC method. Version 1.2. 2018. Available from: https://www.createspace.com/3689652
- Gousbet G, Berlemont A. Eulerian and Lagrangian approaches for predicting the behaviour of discrete particles in turbulent flows. Prog Energy Combust Sci. 1999;25:133–59. Available from: https://doi.org/10.1016/S0360-1285(98)00018-5
- Nordin N. Complex chemistry modeling of diesel spray combustion [dissertation]. Gothenburg (Sweden): Chalmers University of Technology; 2000. Available from: https://www.researchgate.net/publication/296962896_Complex_chemistry_modeling_of_diesel_spray_combustion
- Macpherson GB, Reese JM. Molecular dynamics in arbitrary geometries: Parallel evaluation of pair forces. Mol Simul. 2008;34(1):97–115. Available from: https://doi.org/10.1080/08927020801930554
- Macpherson GB, Nordin N, Weller HG. Particle tracking in unstructured, arbitrary polyhedral meshes for use in CFD and molecular dynamics. Commun Numer Methods Eng. 2009;25(3):263–73. Available from: https://doi.org/10.1002/cnm.1128
- Hemph R, Svensson J, van Wachem BGM, Almstedt AE. Discrete element simulations and experimental validation of particle packing in a 5 mm chromatography column. In: Proceedings of the 6th International Conference on Multiphase Flow; 2007; Leipzig, Germany.
- Chen XQ, Pereira JCF. A new particle-locating method accounting for source distribution and particle-field interpolation for hybrid modelling of strongly coupled two-phase flows in arbitrary coordinates. Numer Heat Transf B Fundam. 1999;35(1):41–63. Available from: https://doi.org/10.1080/104077999276009
- Vaidya AM, Subbarao PMV, Gaur RR. A novel and efficient method for particle locating and advancing over deforming, nonorthogonal mesh. Numer Heat Transf B Fundam. 2006;49(1):67–88. Available from: https://www.tandfonline.com/doi/abs/10.1080/10407790500344043
- Shojaee S, Hosseini SH, Razavi BS. Computational fluid dynamics simulation of multiphase flow in structured packings. J Appl Math. 2012;2012:1–17. Available from: http://bit.ly/3uVEvUD
- Parsi M, Kara M, Agrawal M, Kesana N, Jatale A. CFD simulation of sand particle erosion under multiphase flow conditions. Wear. 2017;376–377:1176–84. Available from: http://bit.ly/2OmxGKY
- Florice NM, Andrei K. Modelling and simulation of multiphase flow applicable to processes in oil and gas industry. Chem Prod Process Model. 2019;20170066:1–16. Available from: https://www.degruyterbrill.com/document/doi/10.1515/cppm-2017-0066/html
- Chen XQ. Efficient particle tracking algorithm for two-phase flows in geometries using curvilinear coordinates. Numer Heat Transf A Appl. 1997;31(4):387–405. Available from: https://doi.org/10.1080/10407789708913897
- Zhou Q, Leschziner MA. An improved particle locating algorithm for Eulerian-Lagrangian computations of two-phase flows in general coordinates. Int J Multiph Flow. 1999;25(4):813–25. Available from: https://ui.adsabs.harvard.edu/link_gateway/1999IJMF...25..377T/doi:10.1016/S0301-9322(98)00054-8
- Chordá R, Blasco JA, Fueyo N. An efficient particle-locating algorithm for application in arbitrary 2D and 3D grids. Int J Multiph Flow. 2002;28(9):1565–80. Available from: https://doi.org/10.1016/S0301-9322(02)00045-9
- Wu JS, Lian YY. Parallel three-dimensional direct simulation Monte Carlo method and its applications. Comput Fluids. 2003;32(9):1133–60. Available from: https://doi.org/10.1016/S0045-7930(02)00083-X
- Mallikarjun S, Casseau V, Yang G, Huang JY, Habashi WG, Gao S, et al. HALO3D: An all-Mach approach to hypersonic flows simulation, Part II. Int J Comput Fluid Dyn. 2024;37:333–6. Available from: https://doi.org/10.1080/10618562.2024.2306946
- Liang J, Yan C, Du BQ. An algorithm study of three-dimensional DSMC simulation based on two-level Cartesian coordinates grid structure. Acta Aerodyn Sin. 2010;28:466–71. Available from: https://pubs.cstam.org.cn/article/id/kqdlxxb_10389
- Wang Z, Li L, Zhang B, Liu H. BCP particle positioning techniques for DSMC method. J Aeronaut Astronaut Aviat. 2019;51:225–36. Available from: http://dx.doi.org/10.6125/JoAAA.201909_51(3).01
- Wang C, Cheng J, Ji L, Lu Y, Sun Y. 2-D DSMC algorithm based on Delaunay triangles. J Tsinghua Univ Sci Technol. 2015;55:1079–86. Available from: https://bit.ly/2OmzcwU
- Ogami Y. Fast algorithms for particle searching and positioning by cell registration and area comparison. Trends Comput Sci Inf Technol. 2021;6(1):7–16. Available from: https://www.engineegroup.com/articles/TCSIT-6-132.php
- Ogami Y, Kamran S. Fast particle search and positioning algorithms using an efficient cell registration method. In: Andriychuk M, Sadollah A, editors. Optimization algorithms - Classics and recent advances. London: IntechOpen; 2023. p. 105–24. Available from: https://www.intechopen.com/chapters/87415
- Sharipov F, Volkov AN. Aerothermodynamics of a sphere in a monatomic gas based on ab initio interatomic potentials over a wide range of gas rarefaction: Transonic, supersonic, and hypersonic flows. J Fluid Mech. 2022;942:A17. Available from: https://doi.org/10.1017/jfm.2022.356
